
Diagnostics#
The Diagnostics plugin displays information published by the diagnostics aggregator collected from different sources on the robot.
Robot panel#
The summary of the Diagnostics button, will show the count of diagnostics that are in error or warning state.

Figure 1: Diagnostics Button
Control center#
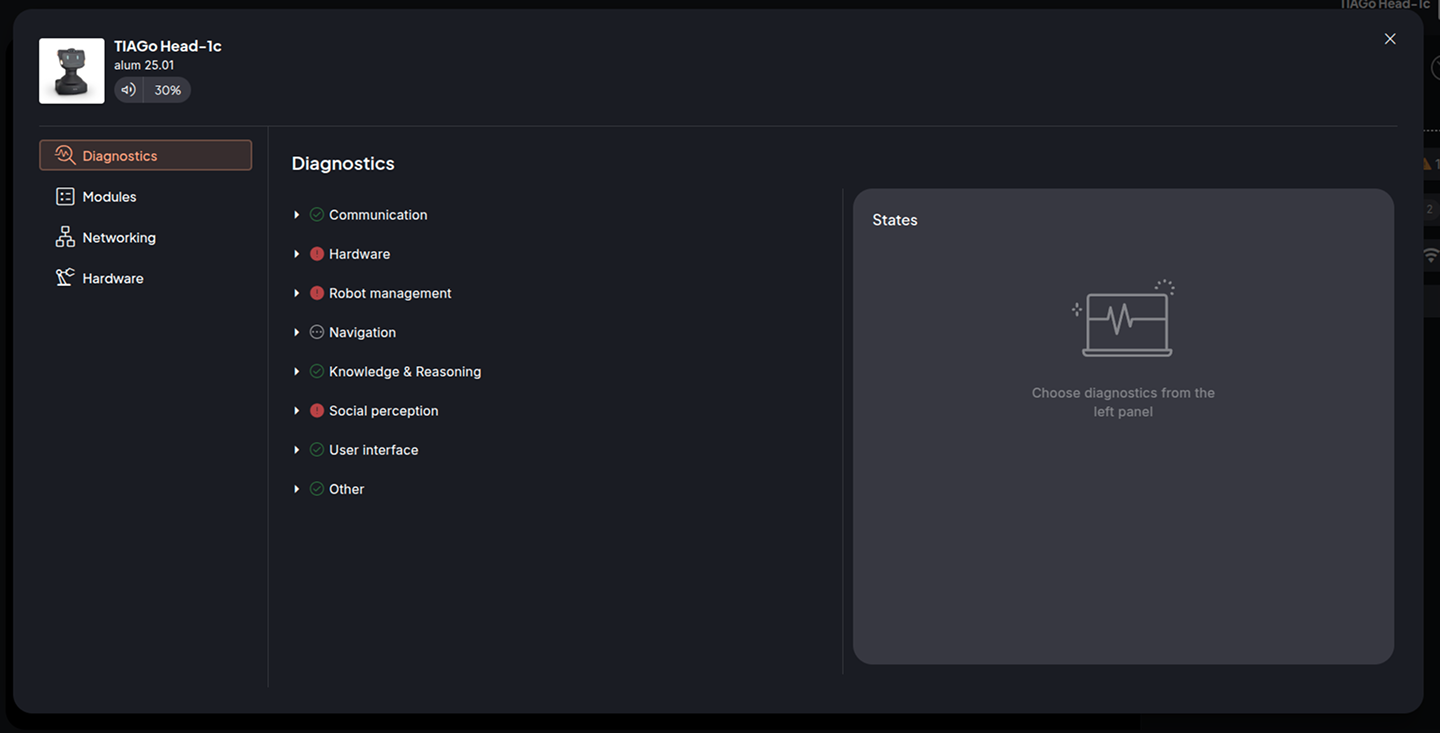
Figure 2: Diagnostics Control Center
The diagnostics data is organized as a hierarchical tree, where each node represents a diagnostic and may contain sub-diagnostics. Each node displays its name and an icon indicating its current status.
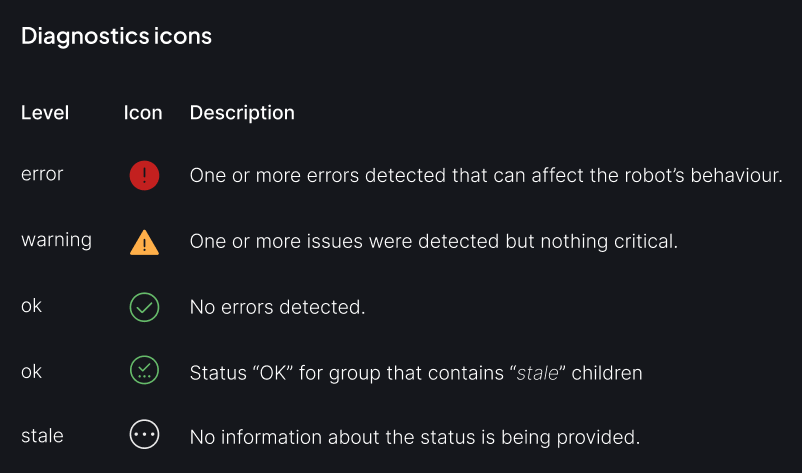
Figure 3: Diagnostics Status Icons
Clicking a node expands its list, revealing any subgroups or items. On the right side of the screen, the States container displays the latest message and entries for the selected diagnostic.
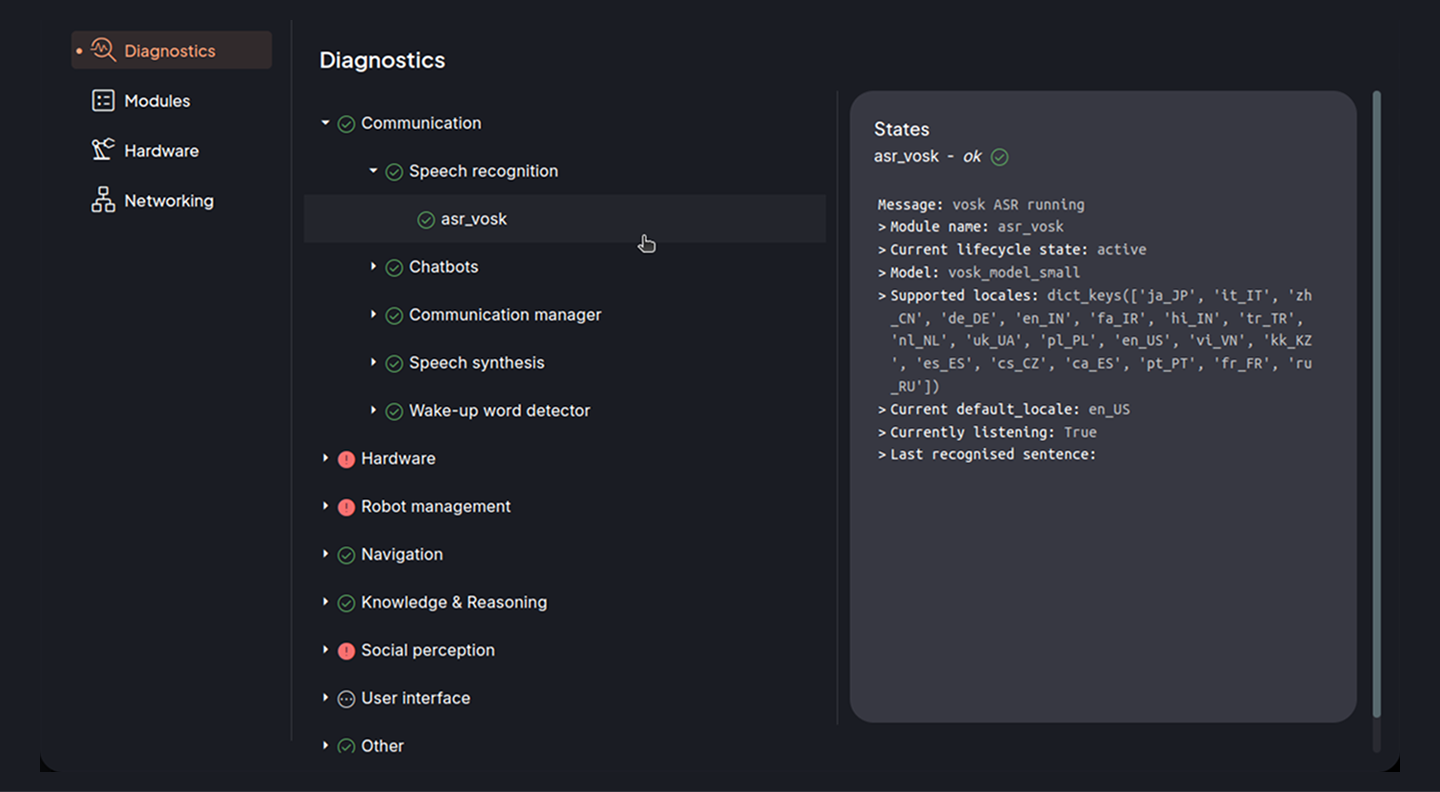
Figure 4: Diagnosics Control Center with selected item