Grafana#
Grafana is a web-based analytics and visualization platform used to display historical data and statistics from various robot components, such as sensors, motors, or onboard computers. It is particularly useful for analyzing trends over time.
Typical use cases include:
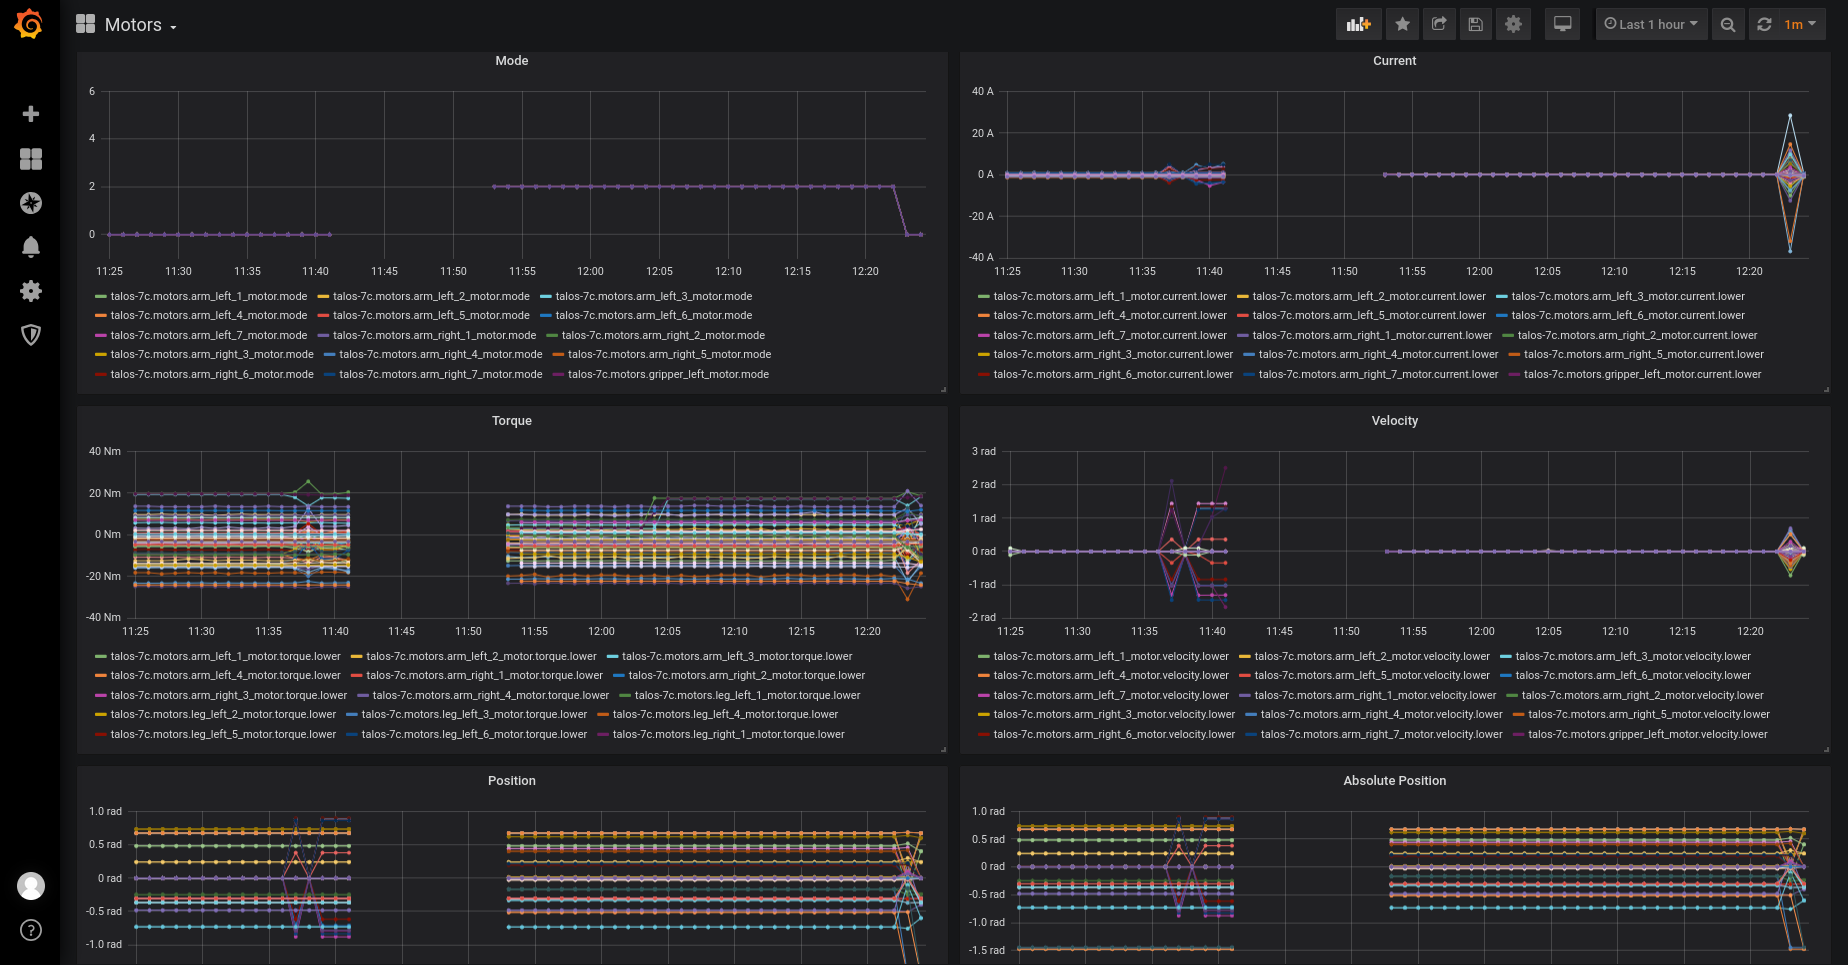
Viewing maximum, mean, or minimum current drawn by motors over a specified time interval.
Monitoring temperature trends, CPU usage, network activity, and other performance metrics.
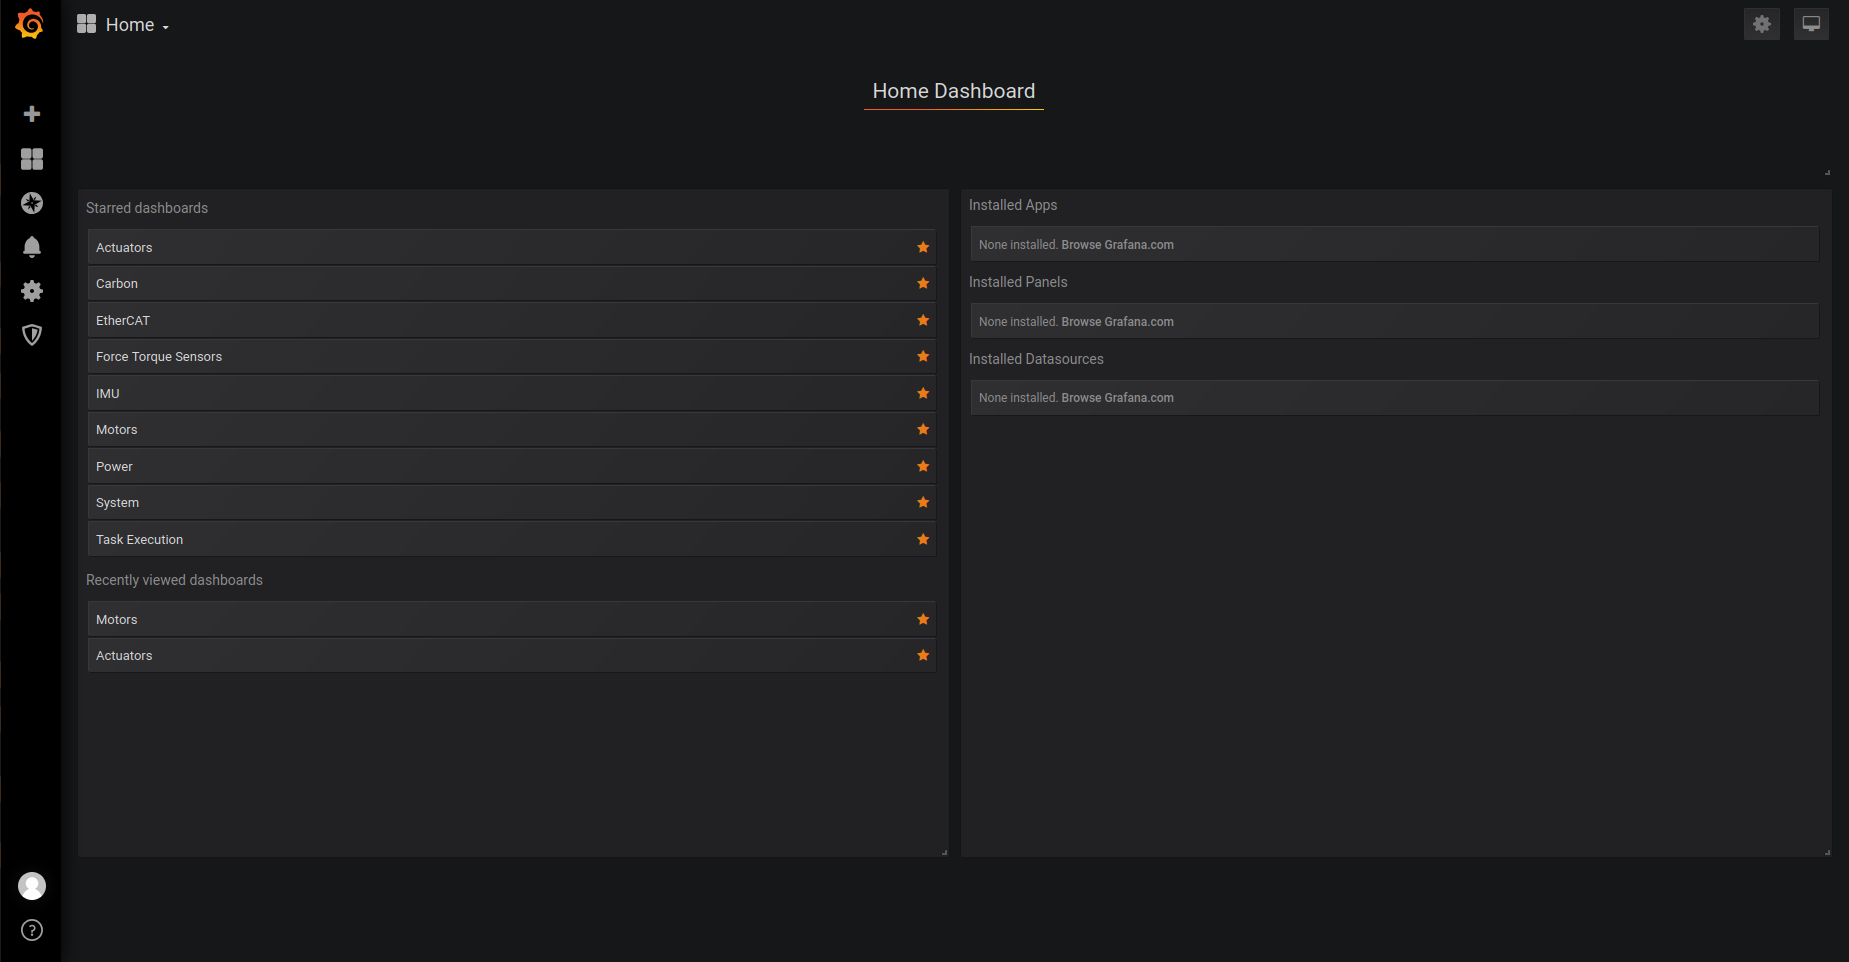
Creating custom dashboards for in-depth analysis of system behavior.
Grafana enables users to gain insights from time-series data, supporting improved diagnostics, performance tuning, and long-term system monitoring.
To open the Grafana open you favorite web browser and type:
http://kangaroo-Xc:3000